Illustration of risk and loss results - RISe
One of the advantages of SELENA is its portability between platforms and its independence of graphic software. However, this independence can also be a disadvantage if the potential user groups feel the lack of a graphical interface is a deficiency.
In cooperation with INETER, one of NORSAR's long-term partners in Central America, a stand-alone software tool called RISe - Risk Illustrator for SELENA has been developed. RISe will allow a quick and straightforward illustration of SELENA's georeferenced input, inventory, and output data in GoogleEarth (GE).
It will thus substitute the use of any commercial GIS program. Furthermore, the tool will help to restrict the study areas in Google Earth and to generate the SELENA input files through an easy-to-understand and user-friendly program surface.
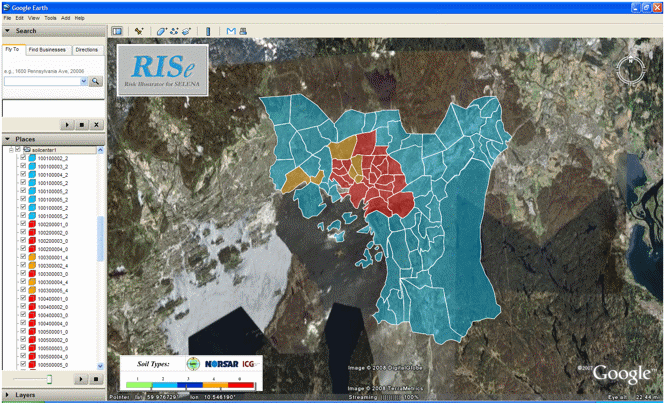
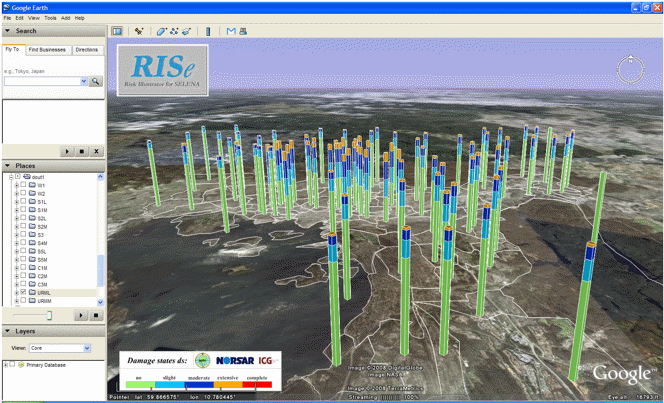
Different ways to illustrate the inventory data or risk results are implemented in RISe. Figures 7 and 8 show two different ways of illustrating the damage probabilities of a particular model building type in the case study Oslo, Norway.
- The RISe software is today a stand-alone software solution that substitutes a commercial GIS solution.
- It facilitates the preparation of SELENA input files.
- It allows distinguishing study areas (census tracts) and illustrating inventory data and risk results in GoogleEarth.

Figure 7. Damage probability as illustrated by use of GoogleEarth. See legend for color code definitions.

Figure 8. Damage probability as illustrated by use of GoogleEarth. See legend for color code definitions.