Electrical Resistivity Tomography - ERT & IP
Measuring the subsurface resistivity distribution is one of the most sophisticated geophysical technologies and can be used for various applications using today's advanced and robust Electrical Resistivity Tomography (ERT) systems.

Electrical Resistivity Tomography (ERT) is a near-surface geophysical method that uses direct current to measure the earth's resistivity. When an electric field is created in the ground, the electric voltage will vary depending on what kind of electric resistance the different materials in the ground have.
For example, clay has very low and granite very high resistance. This voltage field is detected on the surface utilizing several electrodes, and the data is used to model the specific electrical resistance of the ground, called resistivity.

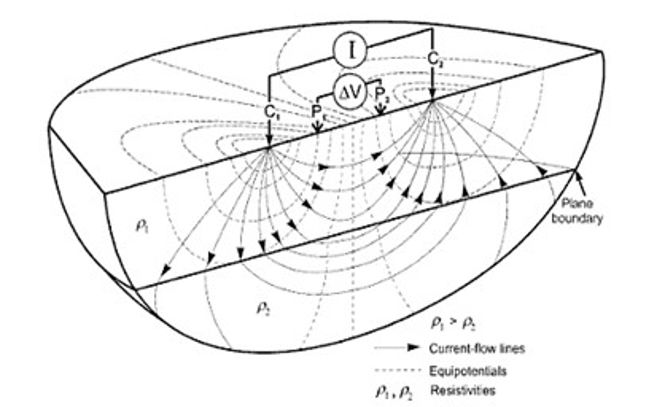
The principle of resistivity measurements. Current is injected via electrodes C1 and C2 at a given current. The resulting voltage field in the ground is measured with electrodes P1 and P2.
In connection with resistivity measurements, measuring the ground's ability to retain electrical charge (electrically induced polarization, IP) is also possible. Between each resistivity measurement, it is registered how fast the voltage field changes. Large mineral grains or ions in the solution could contribute to such polarization.
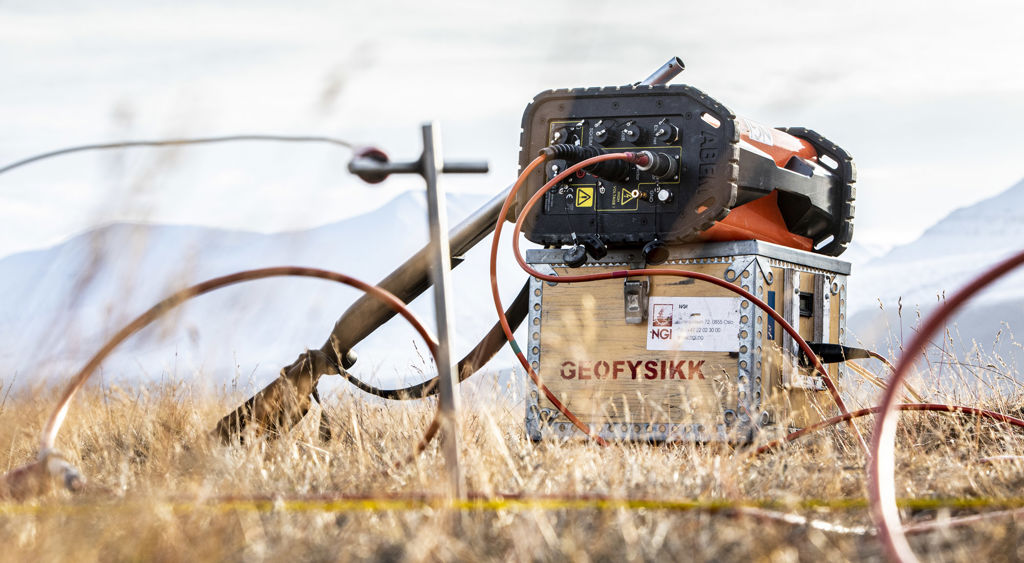
NGI uses an ABEM Terrameter LS2 that supports the efficient collection of both ERT and IP using the 100% duty cycle protocol. NGI was one of the first to use ERT for geotechnical mapping in Norway actively and has extensive experience from over 70 projects.
ERT / IP is a relatively fast mapping method suitable for getting an overview of a larger field or supporting traditional drilling in special circumstances. By mapping across a river, mapping soft masses in bogs, or locating deep gutters or rock separators.

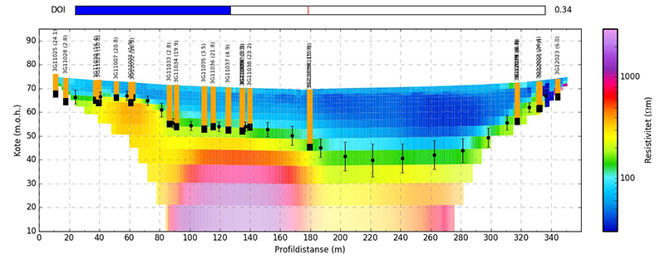
Example of ERT measurements from a field in Ringerike and total soundings carried out near the profile. With only two or three boreholes, you can choose a threshold value for e.g. the rock surface and interpret this (black dots). The measurements also provide continuous information in the rock, and you can clearly see the step formation from the stratified cambro-silurian rocks.

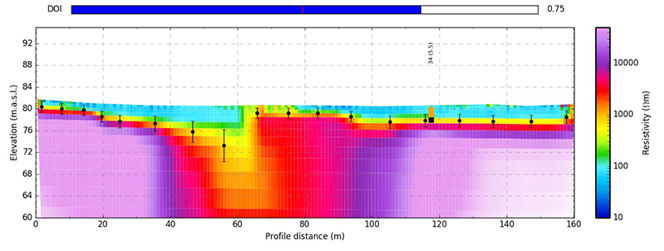
Example of how a zone of weakness can behave in a resistivity profile. The small crack in the rock surface can be difficult to find if you only drill.

Dyre Oliver Dammann
Head of Section Remote Sensing and Geophysics dyre.dammann@ngi.no+47 930 10 310